
A startling fact reveals that less than 10% of all data produced today serves any analytical purpose, while analysts examine less than 1% of it.
Selecting the right data analytics tool is a vital part of helping businesses understand their big data world. Modern data analytics tools have proven their worth by accelerating decision-making, enhancing customer experience, and preparing companies for what lies ahead. Our team of experts has carefully evaluated and compiled a list of data analysis tools that process and analyze structured, semi-structured, and unstructured data from multiple sources.
These 13 tools stand out as the best options available in 2025. You will find them helpful whether you want to start your data experience or upgrade your current analytics stack. Our team has thoroughly tested each tool to give you the insights needed to make the right choice.
Tableau: The Gold Standard for Data Visualization
Image Source: Tableau
Tableau has emerged as a leader in data visualization that turns complex datasets into useful insights. Users of all skill levels can analyze data with this modern analytics tool because it combines powerful visualization features with simple drag-and-drop controls.
Key Features and Capabilities
VizQL, a proprietary language that converts user actions into data queries and visualizations, powers Tableau’s core strength. The platform comes with:
- Advanced data preparation tools to reshape and clean data
- Live analytics with direct data connection capabilities
- Natural language processing to query data intuitively
- Mobile-optimized dashboards that enable analysis anywhere
Expert Use Cases
Tableau’s results shine bright in many industries. To cite an instance, Honeywell’s FP&A Operations saved between 10,000-20,000 man-hours on its coverage and analysis after choosing Tableau. Wells Fargo discovered $10 million in potential cost savings by analyzing travel expenses.
Pricing and ROI Analysis
A Forrester’s independent study revealed that organizations using Tableau achieved a 127% ROI and recovered costs in 13 months. The platform has three main licensing tiers:
- Tableau Viewer: $15/user/month for cloud deployment
- Tableau Explorer: $42/user/month for advanced analytics
- Tableau Creator: $75/user/month for full platform access
Integration Options
Tableau excels at data connectivity with native connectors for many data sources. The platform combines smoothly with:
- Cloud services and data warehouses
- Spreadsheets and PDFs
- Big data platforms and relational databases
- Enterprise applications like Salesforce and Slack
On top of that, Tableau’s shared metadata framework with Einstein 1 speeds up development workflows and boosts administrator efficiency.
Power BI: Microsoft’s Analytics Powerhouse
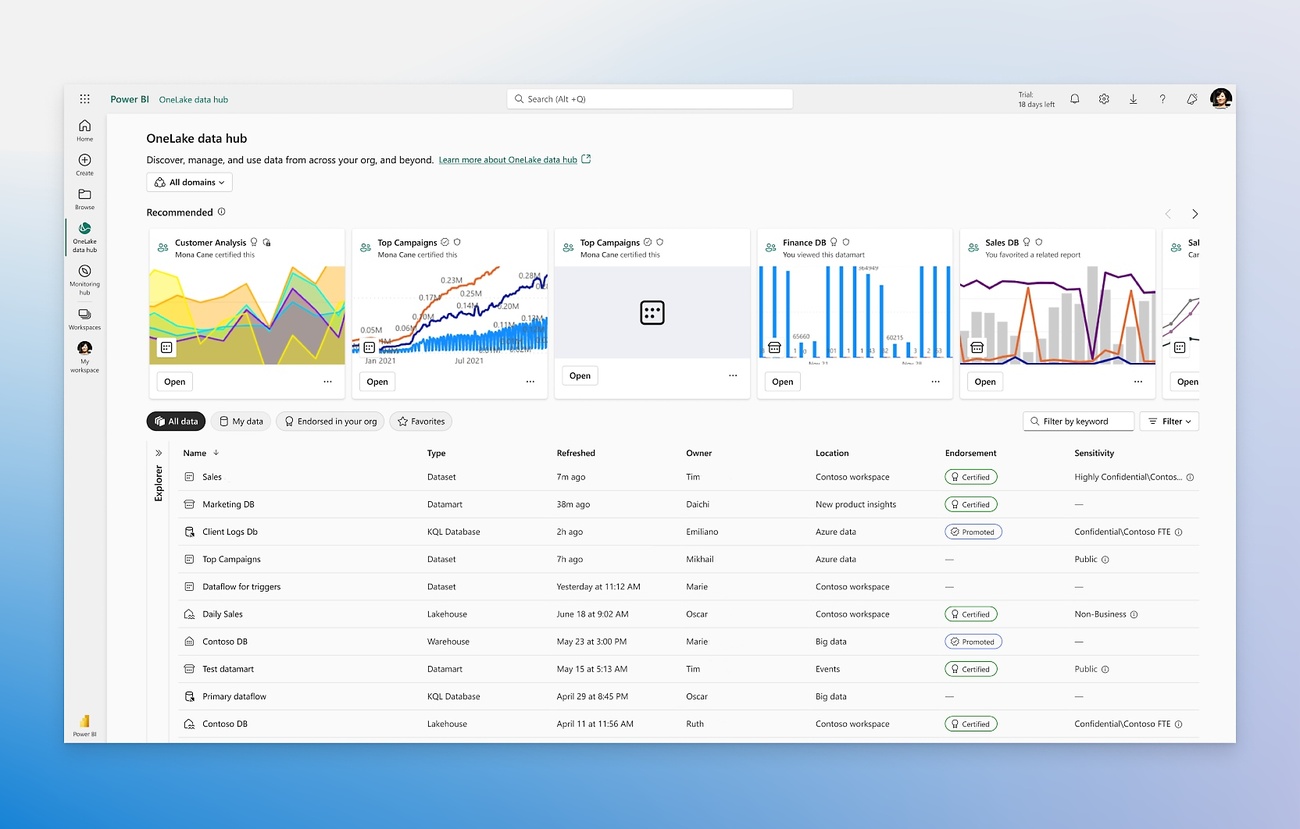
Image Source: Microsoft
Microsoft Power BI leads the data analytics market with 10 million monthly active users. This business intelligence platform combines interactive visualizations and resilient data modeling to deliver detailed analytics solutions.
Core Functionalities
Power BI excels at data transformation and visualization. Users can ask questions about their data and get answers through visualizations thanks to natural language processing. The platform’s accessible interface has three distinct views – report, data, and model view. This makes it available to users of all skill levels.
Enterprise Integration Benefits
The platform works smoothly with Microsoft’s ecosystem. You can connect Power BI to SharePoint, Teams, Excel, and Azure AD without hassle. This integration lets organizations combine data from Microsoft applications of all types. Teams can create practical insights without switching platforms.
Cost Structure
Power BI’s flexible pricing fits different organizational needs:
- Power BI Free: Simple desktop access for individual users
- Power BI Pro: USD 10.00 per user/month, has sharing and collaboration features
- Power BI Premium: USD 4,995.00 per month for dedicated cloud resources
- Power BI Embedded: Variable pricing based on virtual core and memory usage
Ground Applications
Large organizations have found great success with Power BI. The NHS boosted patient care through live analysis and its coverage. Metro Bank automated its financial reporting and reduced manual data entry while improving accuracy. Pfizer uses the platform to monitor clinical trials live. This has boosted their drug development process.
Python with Jupyter Notebooks
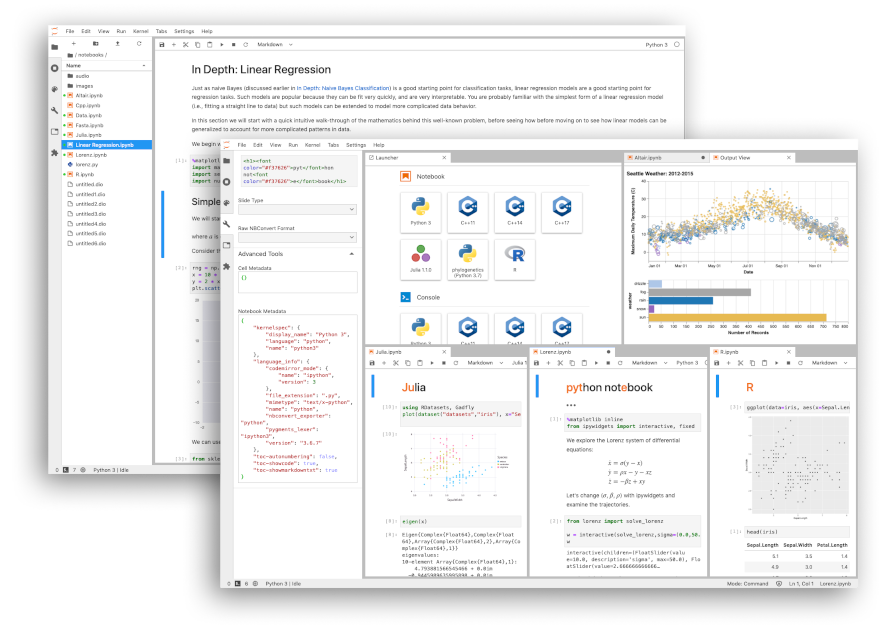
Image Source: jupyter.org
Python is the life-blood of modern data analytics, with over 137,000 libraries supporting a variety of analytical needs.
Advanced Analytics Capabilities
Python’s extensive ecosystem excels in data manipulation through Pandas, numerical computation via NumPy, and statistical analysis with SciPy. Libraries like Scikit-learn make sophisticated machine learning implementations possible, while TensorFlow and PyTorch support advanced AI development.
Data Science Applications
Python’s versatility goes beyond simple analysis. Data scientists control Python’s capabilities to predict consumer priorities and optimize delivery routes. In healthcare, Python-based predictive analytics help forecast disease likelihood from patient datasets. The language streamlines processes when building full-scale machine learning pipelines.
Setup and Requirements
Jupyter Notebooks need Python 3.3 or higher to run. Users can choose between two main installation approaches:
- Anaconda Distribution: New users prefer this option as it bundles Python with essential data science packages
- Manual Installation: A lightweight setup using pip command
pip install notebook
Jupyter’s accessible interface supports over 40 programming languages, though Python remains the top choice for data analytics. The platform makes shared computational documents possible through email, Dropbox, or GitHub, and supports rich output formats including HTML, images, and custom MIME types.
R Studio: Statistical Computing Master
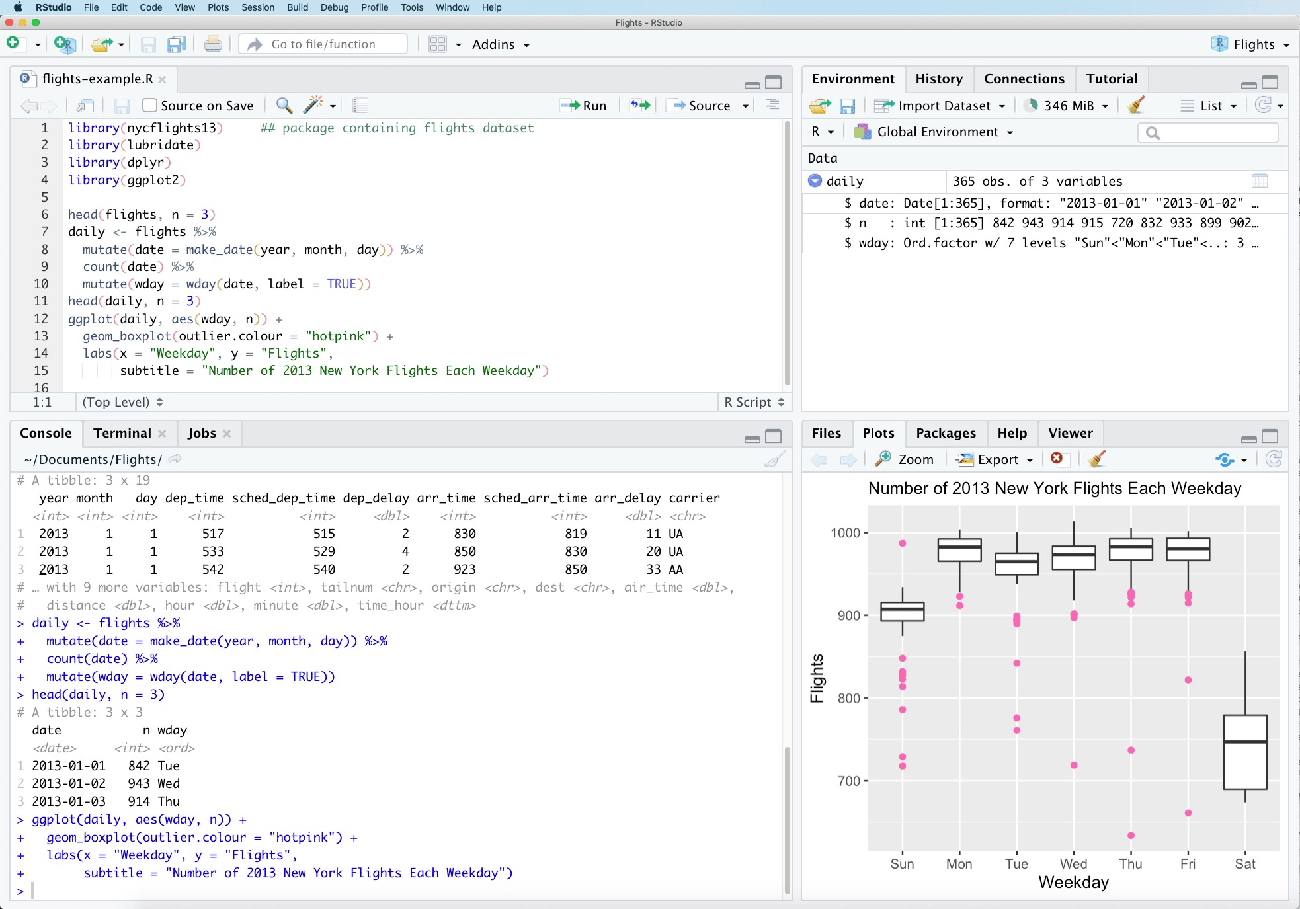
Image Source: Wikipedia
R Studio, a specialized data analytics tool, is now the top choice for statistical computing with over 2 million users worldwide.
Statistical Analysis Features
R Studio’s statistical power comes from its detailed toolkit that performs complex analyzes. The platform offers:
- Univariate and multivariate analysis capabilities
- Advanced regression modeling and ANOVA functions
- Time-series analysis and forecasting tools
- Factor analysis and clustering algorithms
- Geostatistical computation features
R Studio shines in data visualization through packages like ggplot2, which helps users create sophisticated statistical graphics. The platform’s dplyr package makes data manipulation efficient with functions that filter, select, and transform datasets.
Industry Applications
Over the last several years, R Studio has become popular in businesses of all sizes. The financial industry uses R for risk modeling and portfolio optimization. Banking institutions have found R Studio helpful for credit risk analysis and customer segmentation. Healthcare professionals use R for clinical trials, drug discovery, and epidemiological studies.
Learning Curve and Resources
The platform’s RStudio.cloud Primers provide a cloud-based environment for beginners. New users can access free online resources that include detailed documentation and community support. The RStudio Essentials Series features six basic videos about programming basics and project management.
R Studio’s R Markdown feature supports efficient workflows. Users can create dynamic documents that combine code, results, and narrative text. This feature is a great way to get team collaboration and project documentation.
Amplitude: Modern Product Analytics
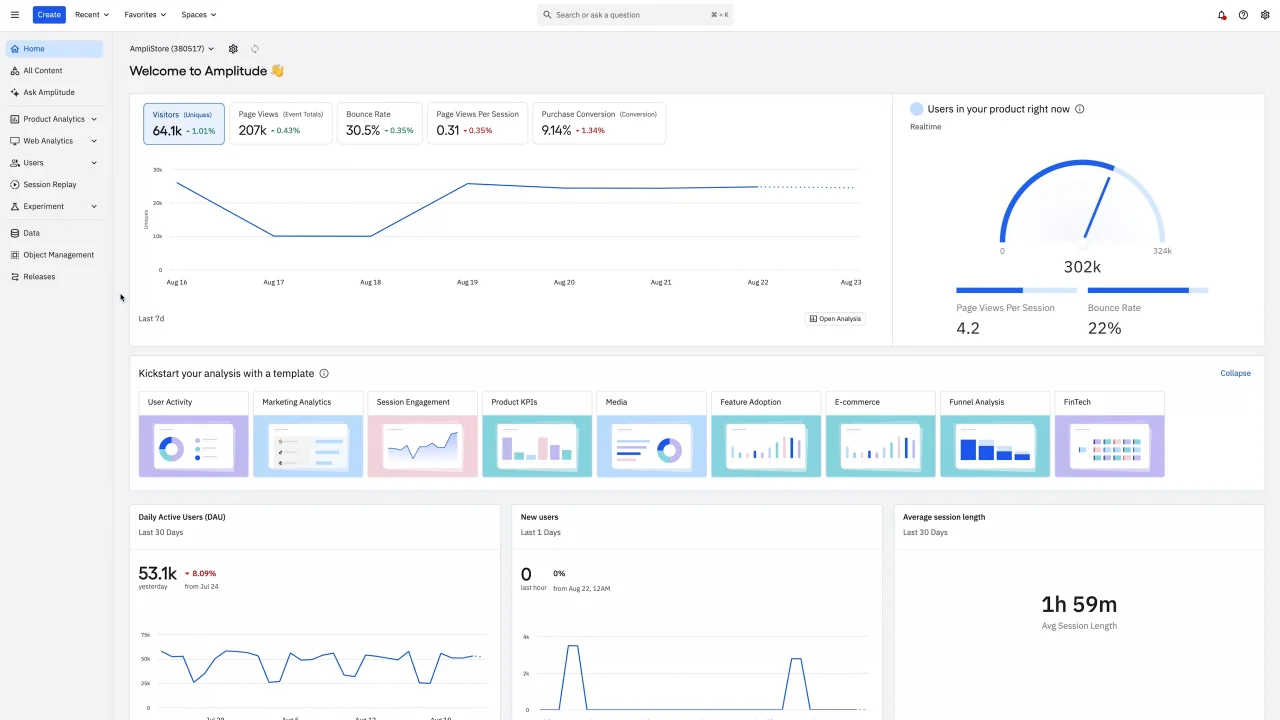
Image Source: Amplitude
Amplitude stands out as a top data analytics tool with its focus on behavioral analytics and customer experience insights.
Behavioral Analytics Features
The platform shines in self-service analytics that lets teams access precise, live behavioral data on their own. Its AI-powered data assistant maintains data quality through built-in cleanup and maintenance features. Teams can exploit behavioral cohorts to group customers based on common traits and product interactions.
User Journey Tracking
Two unique visualizations – Pathfinder and Journey Map – help analyze customer paths. Pathfinder shows flow diagrams of all paths that start or end with specific events. Journey Map spots friction points in user experiences. Teams can study paths within specific conversion windows and filter sequences by custom events.
Pricing Plans
Amplitude’s pricing comes in four tiers:
- Starter: Free plan with up to 50K monthly tracked users
- Plus: Starting at USD 49.00/month with up to 300K monthly tracked users
- Growth: Custom pricing with advanced behavioral analytics
- Enterprise: Custom pricing that includes dedicated support and advanced permissions
Integration Capabilities
Amplitude works with more than 90 tools in their partner ecosystem. The platform’s data connectivity is exceptional with continuous connection to:
- Cloud services and data warehouses
- Marketing automation platforms
- Customer engagement tools
- Business intelligence systems
Native iOS and Android SDKs make mobile implementation simple and track user behavior across devices effectively. Teams can unite their data stack and discover the full potential of their product data through Amplitude’s unified platform.
More info:Review about Amplitude
SAS: Enterprise-Grade Analytics
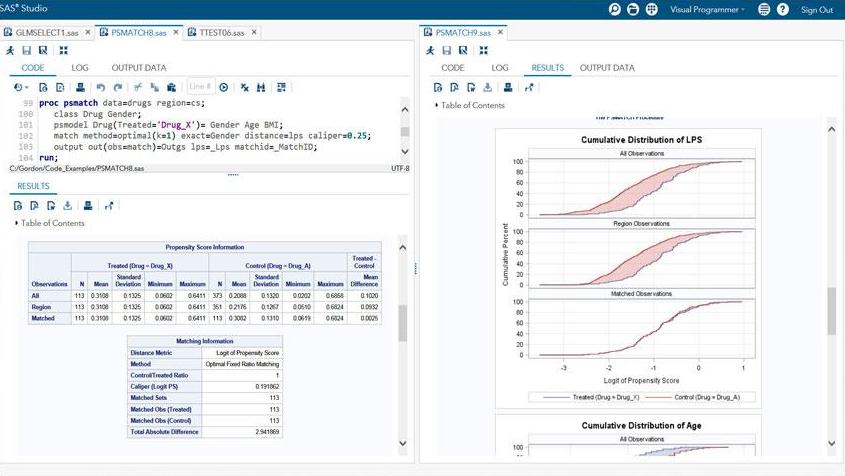
Image Source: SAS Institute
SAS started as a statistical analysis system and has grown into a powerful data analytics tool with USD 1 billion investment in AI development.
Advanced Analytics Features
We excelled in statistical computing and the platform provides extensive capabilities in analysis of variance, Bayesian analysis, and causal analysis. The analytical capabilities extend to advanced forecasting through autoregressive models, volatility forecasting, and stochastic frontier analysis. SAS’s operations research capabilities enable optimization through linear programming algorithms and parallel hybrid global/local search optimization.
Industry Solutions
SAS provides customized solutions in a variety of sectors:
- Banking: Advanced analytics for fraud detection and risk management
- Healthcare: Population health analysis and payment integrity
- Manufacturing: Supply chain optimization and quality control
- Retail: Demand planning and inventory management
- Government: Tax compliance monitoring and fraud detection
Cost Considerations
SAS uses a flexible pricing model that adapts to organizational requirements. The platform’s licensing options start at USD 8,700 for the first year with the Windows Analytics package. Enterprise solutions can cost up to USD 100,000 annually, based on deployment scale and feature requirements. Annual maintenance fees are approximately 28% of the original license cost.
High-performance analytics capabilities support distributed computing across multiple processors, making SAS ideal for large-scale enterprise deployments. Organizations can access cloud-native, massively parallel AI and analytics capabilities through SAS Viya.
Google Analytics 4
Image Source: Google Help
GA4 emerges as a data analytics tool that changes how businesses track and analyze user behavior in 2025.
Web Analytics Capabilities
GA4’s event-based measurement model tracks every user interaction as an individual event. The platform enriches data through improved measurement capabilities instead of focusing on traditional pageviews. The system tracks cross-platform interactions effectively and lets businesses monitor their website and app data within a single property.
Machine Learning Features
GA4’s AI-powered analytics provides three key predictive metrics:
- Purchase Probability: Forecasts conversion likelihood within 7 days
- Churn Probability: Predicts user inactivity in the next week
- Predicted Revenue: Projects 28-day revenue from active users
Properties must meet specific thresholds before these features work. To cite an instance, purchase probability needs at least 1,000 purchasing users and 1,000 non-purchasing users within a 28-day period. These predictions help create targeted audiences for marketing campaigns.
Implementation Guide
GA4 setup works best with a well-laid-out approach. Users must create a GA4 property and add a data stream before data collection starts. The implementation then follows two main paths:
- CMS Integration: Using native CMS features to enter the Google tag ID
- Manual Setup: Direct implementation of tracking code
The system just needs specific criteria to perform well. Properties must maintain minimum user thresholds consistently to keep predictive metrics active. GA4 uses first-party data and AI to fill analytical gaps instead of relying on third-party cookies. This ensures privacy-compliant tracking in today’s digital world.
Apache Spark: Big Data Processing
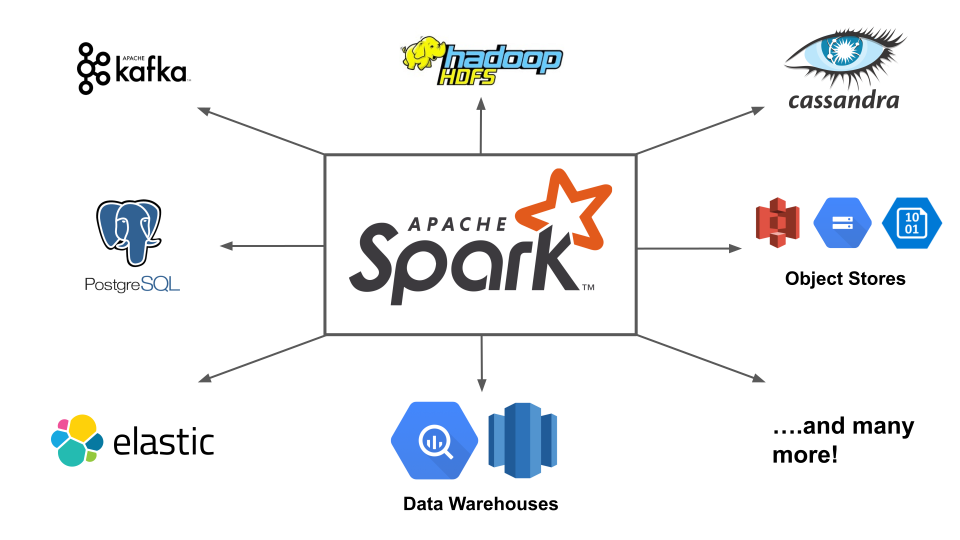
Image Source: Data Mechanics
Apache Spark processes data up to 100 times faster in memory and 10 times faster on disk than traditional frameworks.
Processing Capabilities
Apache Spark’s core strength comes from its Resilient Distributed Dataset (RDD) system that enables fault-tolerant data processing across multiple nodes. The platform excels at:
- Batch processing for large datasets
- Live stream analysis
- Machine learning computations
- SQL-based data querying
- Graph processing algorithms
Spark achieves its speed through in-memory computation and stores intermediate data in RAM instead of writing to disk. This approach reduces data access latency and helps iterative algorithms run efficiently.
Use Cases
Apache Spark shows remarkable versatility in many industries. Financial institutions employ Spark to detect fraud and assess risks in real-time. Gaming companies use its capabilities to analyze in-game events, which helps them adjust levels dynamically and create targeted advertising.
The platform’s streaming capabilities work great with IoT sensor data processing, while its MLlib library supports sophisticated machine learning applications. Many organizations use Spark to process complex ETL operations with data from HDFS, S3, and JDBC sources.
Technical Requirements
Apache Spark needs specific hardware configurations to perform at its best. Each machine should have 8-16 CPU cores and 8 GiB to hundreds of gigabytes of memory. You should allocate only 75% of available memory to Spark and keep the rest for system operations.
A resilient network infrastructure with 10 Gigabit or higher speed becomes essential for distributed computing tasks. The system works best with 4-8 disks per node, set up without RAID for maximum efficiency. Spark can run on different cluster managers like standalone mode, Apache Mesos, or Hadoop YARN, which gives you flexibility in deployment options.
KNIME: Open-Source Analytics
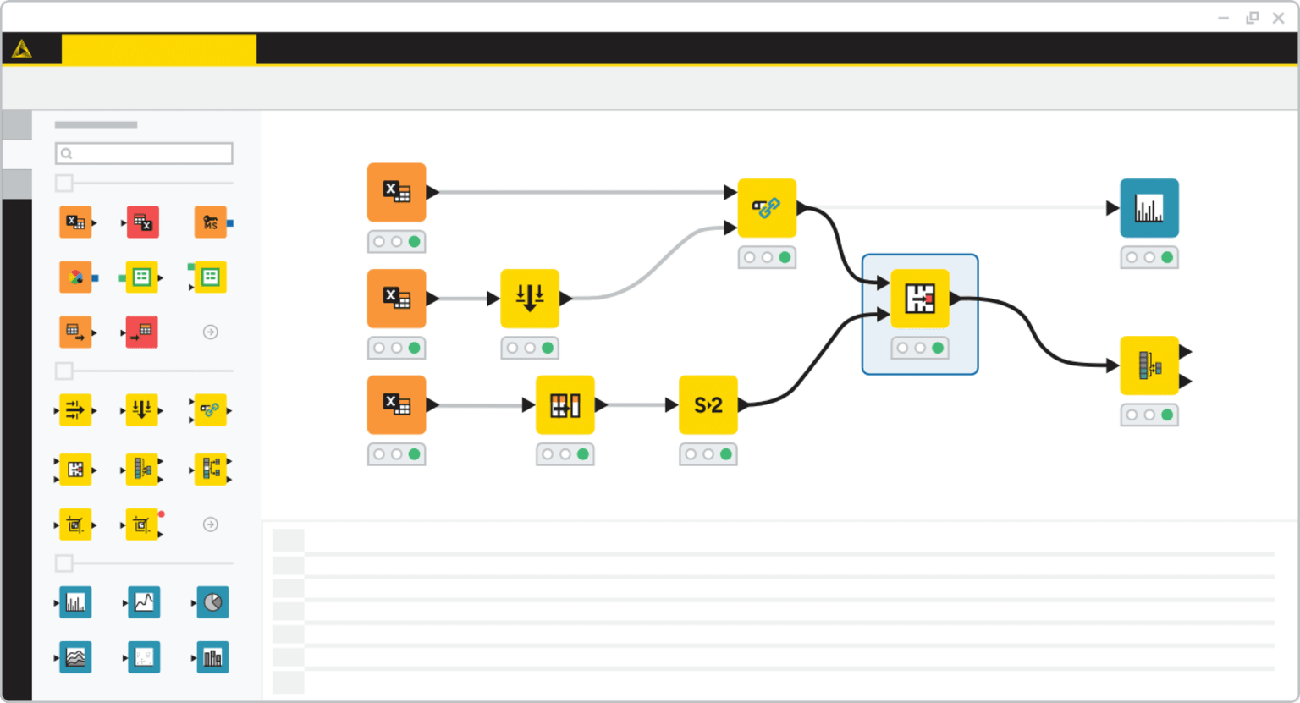
Image Source: KNIME
KNIME Analytics Platform is a versatile open-source data analytics tool that lets users create visual workflows without programming skills.
Data Mining Features
The platform excels in visual programming and provides over 300 built-in nodes for data access, manipulation, and predictive analytics. Users can perform sophisticated data operations through a drag-and-drop interface, ranging from simple transformations to advanced analytics. The platform’s ability to work with multiple data sources makes it stand out. These sources include SQL Server, Oracle, and Neo4j databases.
Machine Learning Capabilities
KNIME’s machine learning toolkit includes a broad spectrum of techniques:
- Advanced supervised and unsupervised learning algorithms
- Deep learning extensions with neural network support
- Automated machine learning through guided automation
- Time series analysis and forecasting tools
KNIME maintains accessibility through K-AI, an AI assistant that guides users in workflow creation and answers technical questions, despite its sophisticated capabilities.
Community Support
More than 100,000 active users make up KNIME Analytics Platform’s thriving community. The KNIME Community Hub hosts over 14,000 data science solutions for various use cases. Users can access detailed learning resources that include self-paced courses, technical documentation, and certification programs.
The platform’s strength lies in its flexibility that allows users to blend popular ML libraries like scikit-learn, TensorFlow, and XGBoost. Its open-source nature will give a continuous integration of state-of-the-art techniques, keeping users at the vanguard of data science innovations.
Looker: Cloud-Native Analytics

Image Source: Swipe Insight
Looker revolutionized cloud-based business intelligence after becoming part of Google Cloud. The platform brings a fresh approach to data analytics through its semantic modeling layer.
Business Intelligence Features
Looker’s foundation rests on LookML, a proprietary modeling language built around SQL. Data teams can create reusable models that ensure consistent reporting. The platform shines in version control. Teams can track changes, identify authors, and understand why modifications were made. Users can access pre-built code pieces through Looker Blocks, which range from complete data models to custom visualizations.
Cloud Integration
Google Cloud Platform integration makes Looker stand out with uninterrupted connections to BigQuery, Cloud Storage, and CloudSQL. We processed queries directly at the database level, which eliminates complex data extractions. The platform connects to over 800 data sources. Its up-to-the-minute data processing ensures dashboard updates happen instantly when new information arrives.
Pricing Structure
Looker comes in three distinct platform editions:
- Standard: Built for organizations with under 50 users, this plan has one production instance, 10 Standard Users, 2 Developer Users, and 1,000 monthly API calls
- Enterprise: This edition provides enhanced security features and supports up to 100,000 query-based API calls monthly
- Embed: This version scales for external analytics and supports up to 500,000 query-based API calls monthly
The platform’s cost varies based on deployment scale. The Standard plan starts at USD 5,000 per month. User licensing covers Developer Users with full platform access, Standard Users who create dashboards, and Viewer Users who consume simple data.
Sisense: Embedded Analytics Leader
Image Source: Sisense
Sisense helps organizations add data insights right into their apps and workflows with its ground-up design for embedded analytics.
Embedded Analytics Features
The platform’s Compose SDK gives developers complete control over analytics integration. They can run queries and create custom data visualizations directly in applications. Teams can add customizable widgets and filters while keeping all functions through Sisense.JS. Users gave the platform’s dashboards 8.7 in satisfaction ratings. These dashboards provide powerful tools to show data clearly.
Implementation Options
Sisense gives you several ways to embed based on what you need technically:
- Simple iFrame integration lets you deploy quickly with minimal code
- Embed SDK improves app communication
- Sisense.JS library allows full customization
- Compose SDK helps implement code-driven analytics
The platform combines smoothly with existing tech stacks through its 100+ data connectors. Its first-party data processing makes analytics privacy-compliant, which works well for enterprise-level projects.
Cost Analysis
Sisense’s pricing changes based on how you deploy it and what you need. Self-hosted solutions start at USD 35,000 yearly for 35-40 users. Cloud-hosted setups with 50 users typically cost USD 50,000 each year. Companies should think over these extra costs:
- Training and onboarding needs
- Version upgrades and maintenance
- Customer success team support
The platform’s elasticube technology adjusts to different computing needs. Pricing reflects your database size and how many users work at once. Companies can expand their analytics setup based on actual usage and growth needs.
RapidMiner: Automated Machine Learning
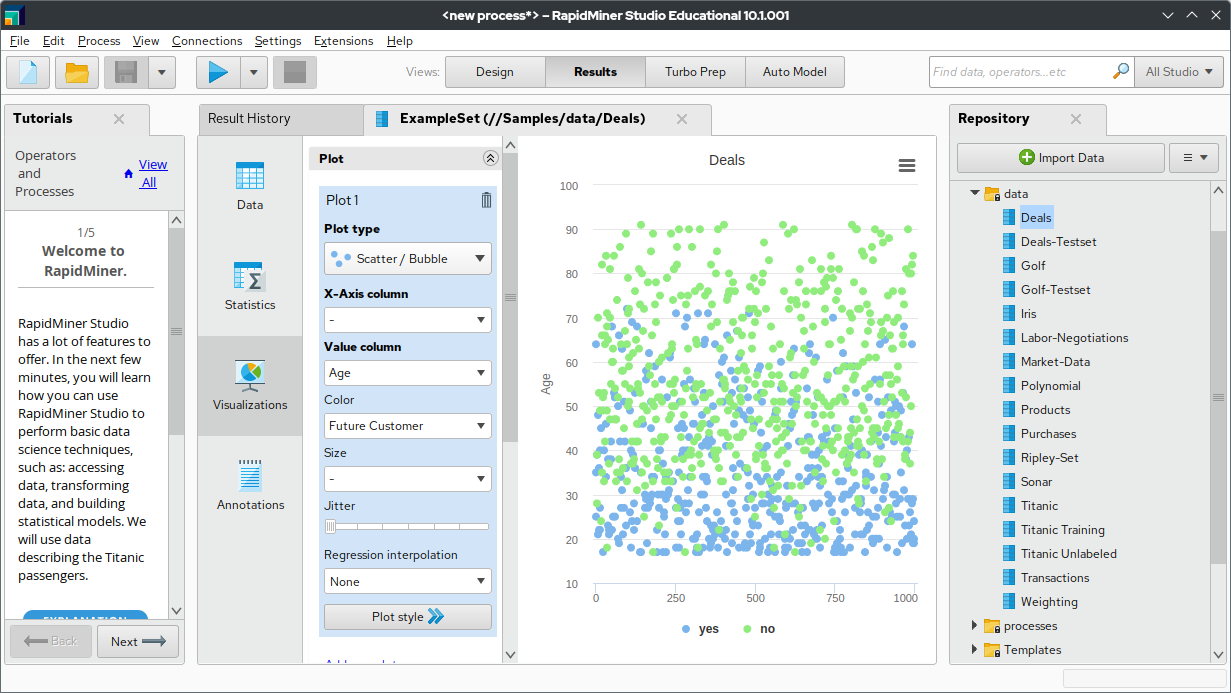
Image Source: Wikipedia
RapidMiner is pioneering automated machine learning and gives both technical and non-technical users the ability to work with its complete AutoML toolset.
AutoML Capabilities
The Auto Model extension speeds up model building and validation processes. RapidMiner works with three main types of problems:
- Prediction (classification and regression)
- Clustering
- Outlier detection
The platform’s easy-to-use wizard-based interface helps users create production-ready models. RapidMiner’s automated clustering capabilities work alongside its predictive modeling and time series forecasting features.
Use Cases
RapidMiner shows impressive versatility in companies of all sizes:
- Delivery companies use Real Time Scoring Agent to predict storage needs
- Chemical manufacturers predict product quality without constant lab testing
- Banks process large amounts of transaction data automatically
- Car manufacturers give data science tools to thousands of engineers
Marketing teams also use the platform to analyze direct mail programs and mine call transcripts for insights.
Pricing Options
RapidMiner comes with different pricing tiers:
- Personal Edition: Free version that handles up to 10,000 rows of data
- Academic Edition: Yearly subscription for university-owned computers
- Standard Edition: Yearly subscription with workstation, server, and cloud access
The platform ended up supporting many deployment options, from desktops to on-premises servers and secure cloud setups. Companies can grow their analytics setup based on their needs, and the Standard Edition handles unlimited data processing.
TensorFlow: Deep Learning Framework
Image Source: www.tensorflow.org
TensorFlow, a powerful data analytics tool, is now 8 years old with widespread adoption in industries. It processes complex relationships between objects and helps with everything from traffic forecasting to medical discoveries.
AI Capabilities
TensorFlow excels at creating machine learning models through its high-level Keras API. Its sophisticated architecture supports distributed training across multiple GPUs and provides quick model iteration with robust debugging features. The TensorFlow ecosystem has pre-trained models from Google and the community that help implement state-of-the-art research quickly.
Implementation Guide
Users can deploy TensorFlow in several ways:
- Cloud services with TensorFlow Serving for production-scale deployment
- Mobile and edge devices including Android, iOS, and Raspberry Pi
- Web browsers using JavaScript or Node.js
- Microcontrollers for edge computing applications
Developers can also use TensorFlow Extended (TFX) for end-to-end production that covers data validation, model training, and evaluation.
Resource Requirements
TensorFlow needs specific system configurations to perform optimally. It works with Python 3.9-3.12, while hardware requirements change based on deployment type. Linux systems need NVIDIA® GPU drivers version 525.60.13 or higher. The platform supports CUDA® architectures from 3.5 to 8.0 and beyond. You can run TensorFlow on Ubuntu 16.04 or higher, macOS 12.0 (Monterey) or higher, and Windows 10 19044 or newer for WSL2.
Conclusion
Data analytics tools have evolved by a lot and now offer solutions for every need and skill level. Our largest longitudinal study of these 13 tools shows that each one serves unique purposes. Tableau’s powerful visualizations and TensorFlow’s deep learning capabilities stand out among them.
Companies starting their data trip can find Google Analytics 4 or Amplitude suitable for their original analytics needs. Technical teams lean towards Python with Jupyter Notebooks or R Studio when they need advanced statistical analysis. SAS or Power BI work best for large enterprises that need detailed solutions.
The price range includes free open-source options like KNIME and Apache Spark, while enterprise-grade tools like Sisense and Looker need investment. The price tag shouldn’t be your only deciding factor – you need to think over integration capabilities, user expertise needs, and specific analytical requirements.
A tool’s success depends nowhere near as much on its features as it does on how well it matches your specific needs. We suggest getting a full picture of your needs, team’s capabilities, and budget before picking from these powerful options.
FAQs
Q1. What are some of the most popular data analytics tools used by experts in 2025? Some of the most popular data analytics tools used by experts in 2025 include Tableau for data visualization, Power BI for business intelligence, Python with Jupyter Notebooks for programming and analysis, R Studio for statistical computing, and Google Analytics 4 for web analytics.
Q2. How does Tableau compare to other data visualization tools? Tableau stands out for its powerful VizQL language, real-time analytics capabilities, and natural language processing features. It offers a 127% ROI with a 13-month payback period and has helped companies like Honeywell save thousands of man-hours in reporting and analysis.
Q3. What are the key features of Google Analytics 4? Google Analytics 4 offers event-based measurement, cross-platform tracking, and AI-powered predictive metrics. It uses first-party data and machine learning to provide insights on purchase probability, churn probability, and predicted revenue, making it a powerful tool for businesses of all sizes.
Q4. How does Apache Spark handle big data processing? Apache Spark processes data up to 100 times faster in memory and 10 times faster on disk compared to traditional frameworks. It uses Resilient Distributed Datasets (RDD) for fault-tolerant data processing across multiple nodes and excels in batch processing, real-time stream analysis, and machine learning computations.
Q5. What makes TensorFlow a popular choice for deep learning? TensorFlow is widely used for its high-level Keras API, distributed training capabilities across multiple GPUs, and access to pre-trained models from Google and the community. It supports various deployment options, including cloud services, mobile devices, web browsers, and microcontrollers, making it versatile for different AI applications.